Chaining a U-Net With a Residual U-Net for Retinal Blood Vessels Segmentation [Eng]
1. Problem definition
Only the retina can observe the cardiovascular system non-invasively.
Through this, information such as the development of cardiovascular disease and the change in shape of microvascular vessels can be obtained.
This is an important indicator for ophthalmology diagnosis.
In this work, the U-Net 1 (+ Residual U-net 2) model is used to distinguish the pixels corresponding to the vessel from the retina image.(Image Segmentation)
Morphological features of blood vessels are obtained from this.
➔ Compared to the previous methods, the trade-off between training time and performance was minimized
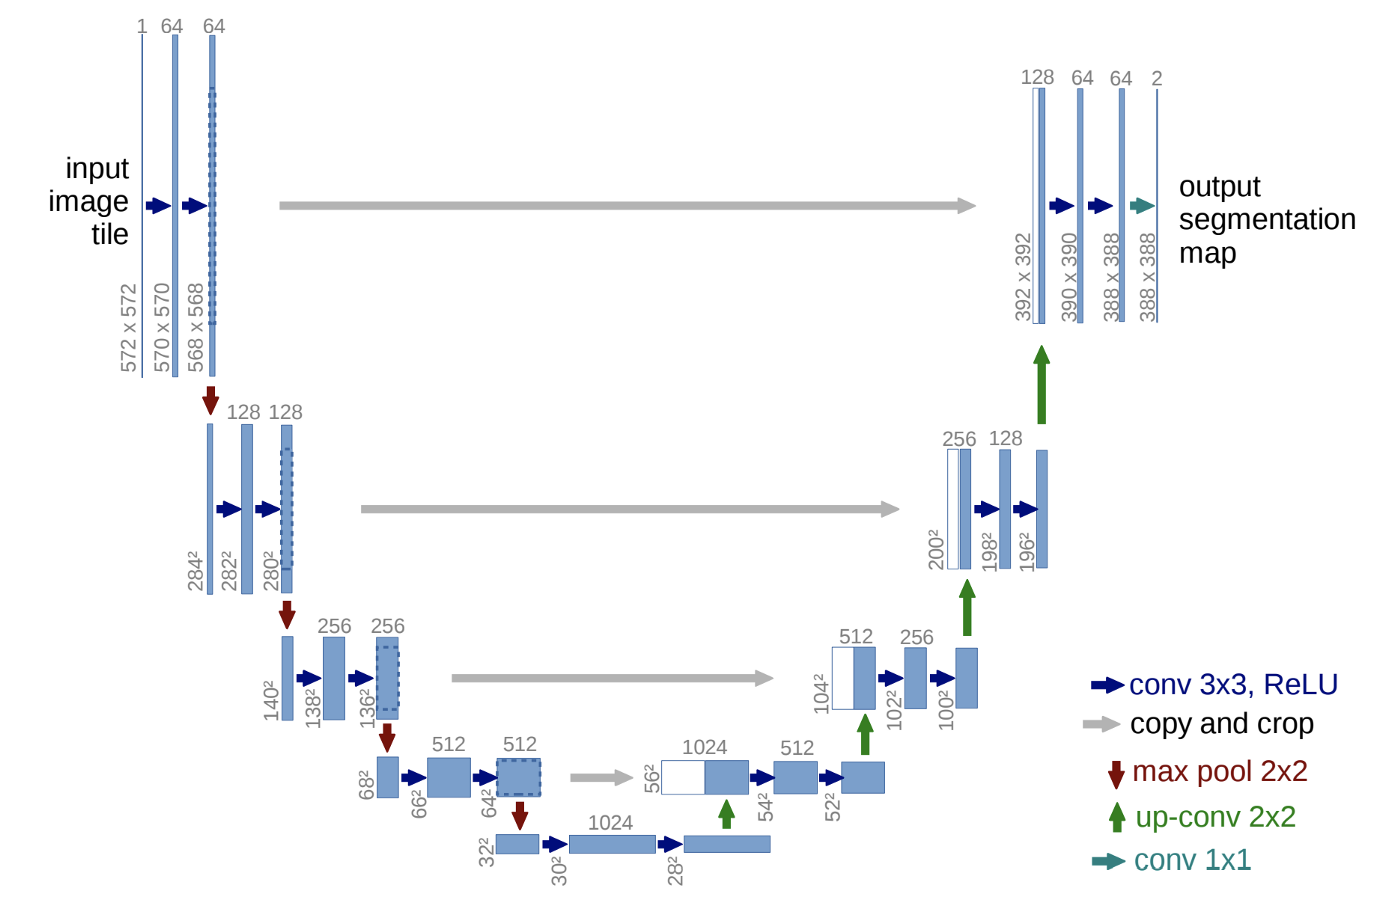
U-Net : A fully-convolutional network-based model of the proposed end-to-end method for image segmentation in the biomedical field.
Link: U-net
2. Motivation
Related work
Currently, most image segmentation algorithms are based on CNN.
[Cai et al., 2016] CNN is also used by VGG net, which we are familiar with.
[Dasgupta et al., 2017] CNN과 A multi-label inference task is performed by combining CNN and structured prediction.
[Alom et al., 2018] Residual blocks were introduced and supplemented with recurrent residual Convolution Layer.
[Zhuang et al., 2019] Double stacked U-nets increase the path of residual blocks.
[Khanal et al., 2019] Background pixels and blood vessels were balanced using stochastic weights, and ambiguous pixels were balanced with reduced network once more.
Idea
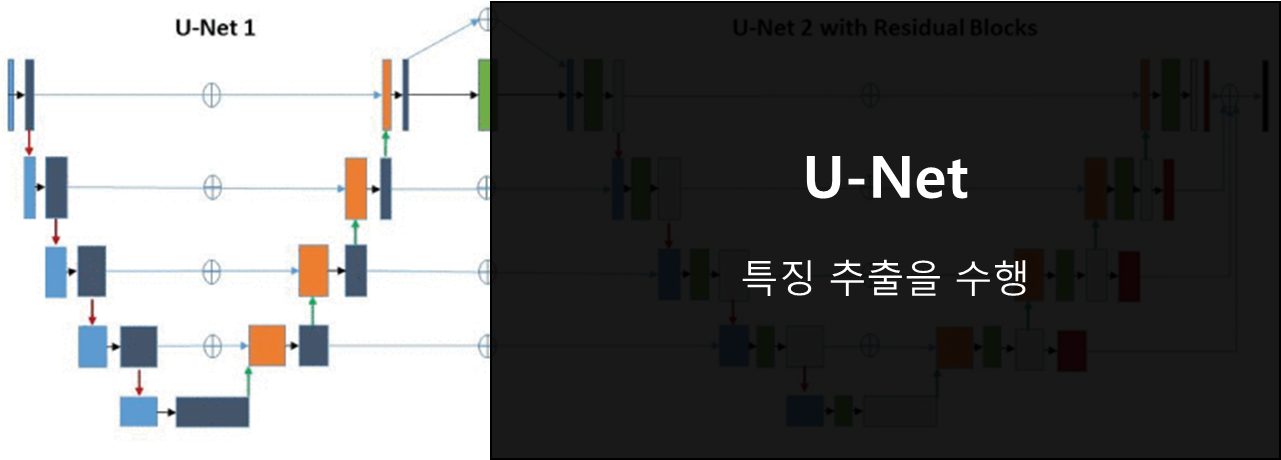
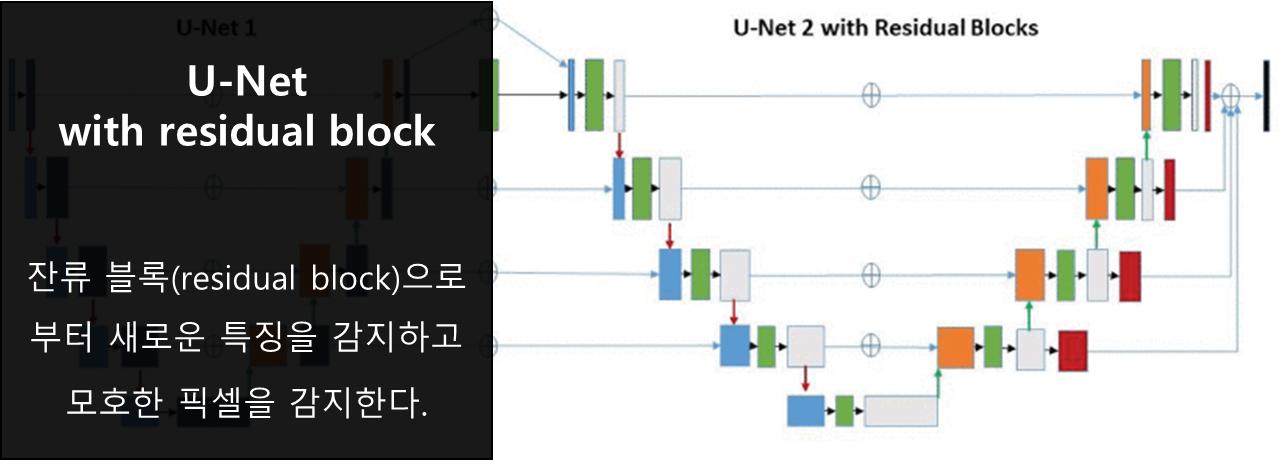
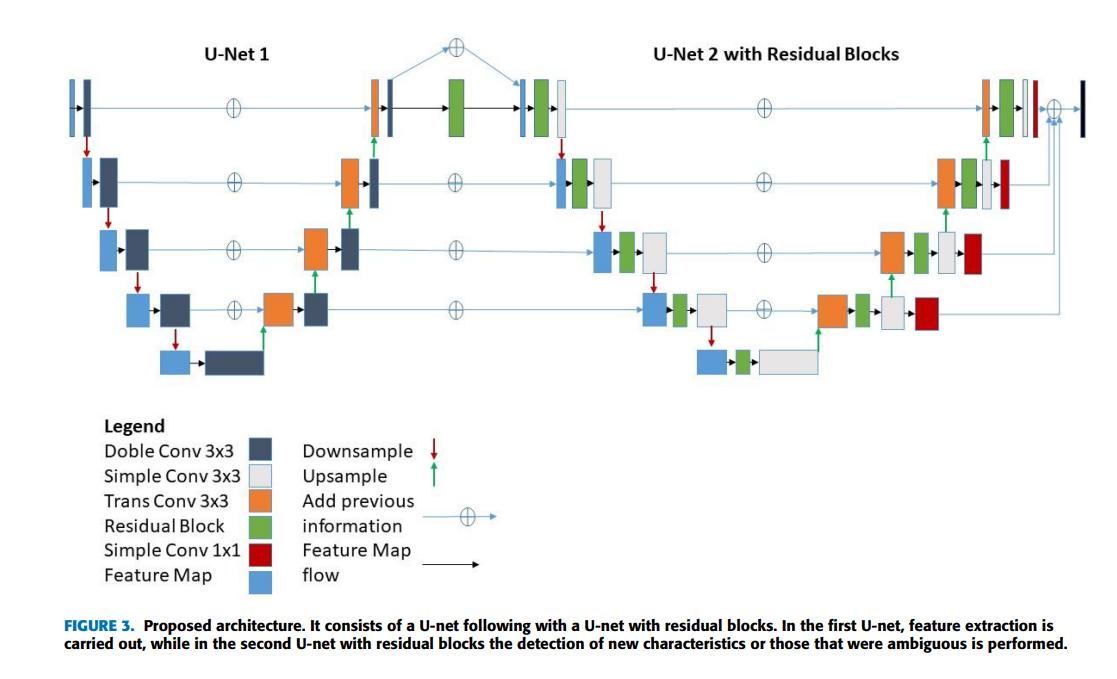
This study proposes a structure which the U-Net1 and U-Net2 with residual blocks are linked.
The first part (U-Net1) extracts features
The second part (U-Net2 with residual blocks) recognizes new features and ambiguous pixels from residual blocks.
3. Method
The workflow of this study is as follows.
Image acquisition
Collect retinal pictures.
Pre-processing
Feature extraction, pattern highlighting, normalization, and etc.
Select characteristics that will be applied to the CNN architecture.
Weight adjustment and performance evaluation
The plan is designed to be ongoing for the greatest outcomes.
Interpretation of the results
1. Pre-Processing
The quality of the image can be improved through preprocessing, which is a very important step for CNN to detect specific characteristics.
Step1
Converts RGB images into gray scale images. This increases the contrast between blood vessels and backgrounds.
The formula for this is as follows:
 Here, RGB is a channel of an image, respectively. In the above equation, G (Green) is emphasized the most and thought to be the least noisy and contains all of the image's features.
Step2
This is the normalization stage of the data. This step is very useful for classification algorithms and especially for backpropagation neural network structures. A decrease in training time may be predicted if the values taken from each training data set are normalized.
In this study, two normalization methods were used.
Min-Max normalization
The lowest value for all features is 0, the maximum value is 1, and all other values are converted to values between 0 and 1. If a characteristic has a minimum value of 20 and a maximum value of 40, for example, 30 is changed to 0.5 since it is midpoint between the two. It has the ability to linearly transform input data while preserving the original value.
If the minimum-maximum normalization is performed for the value v, the following equation can be used.

v': is a normalized value
v: Original value
A: Attribute value (here is the brightness of each channel). 0 is the darkest, 255 is the brightest)
MAXA: Largest brightness value in input data (image)
MINA: Smallest brightness value in input data (image)
Z-Score Normalization
Z-score normalization is a data normalization strategy that reduce the effect of outliers. If the value of the feature matches the average, it will be normalized to 0, but if it is smaller than the average, it will be negative, and if it is larger than the average, it will be positive. The magnitude of the negative and positive numbers calculated at this time is determined by the standard deviation of the feature. So if the standard deviation of the data is large (the value is spread widely), the normalized value approaches zero. It is possible to effectively process outliers compared to maximum-minimum normalization.

σA: standard deviation
A′: the average value of A
Step3
The third step is to apply "Contrast Limited Adaptive Histogram Equalization (CLAHE), an effective way to uniformly improve the details of gray scale retina images.
Images with histogram values concentrated in certain areas have low contrast and can be considered bad quality images
When the histogram is uniformly dispersed across the entire image, it is a good image. The task of distributing distributions concentrated in a particular area evenly is called histogram equalization
While conventional histogram equalization tasks are difficult to achieve desired results by proceeding with the entire pixel, CLAHE can obtain good quality images because it uniformizes images by dividing images into small blocks of constant size
Link: CLAHE
Step4
The final step is to adjust the brightness through gamma values. This distributes the brightness concentrated in a certain region, preventing potential block to feature extraction.
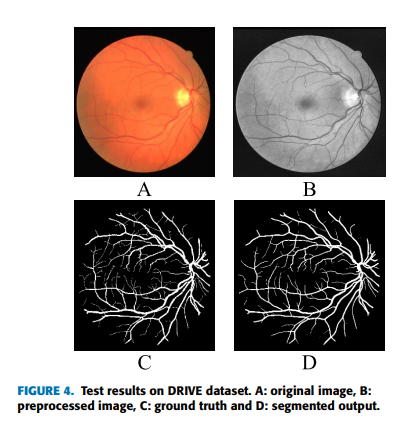
The image obtained through pre-processing is as follows
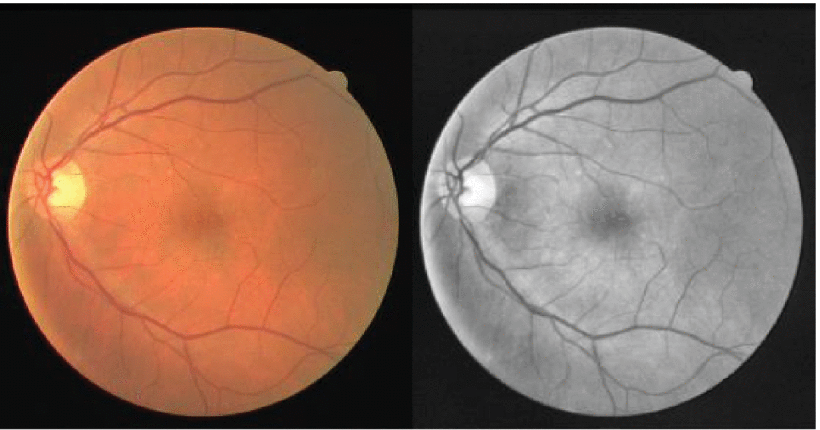
Patches are extracted from pre-processed images to obtain larger datasets and use them for training configured neural networks. In addition, various flippings are given to these patches to secure additional available data.
2. Architecture
In this study, a double-connected U-Net was used, and a residual network was used for the second part.
U-Netconsists of a symmetrical network for obtaining the overall context information of the image and a network for accurate localization.
U-Net:
The Contracting Path
Repeat 3x3 convolutions twice (no padding)
Activation function is ReLU
2x2 max-pooling (stride: 2)
Doubles the number of channels per down-sampling
Expanding Path extends the feature map with operations opposite to Contracting Path.
The Expanding Path
2x2 convolution ("up-convolution")
Repeat 3x3 convolutions twice (no padding)
Cut the number of channels by half per Up-sampling with Up-Conv
Activation function is ReLU
Up-Conv feature map concatenates with a feature map with a cropped border of the Contracting path
Operate 1x1 convolution on the last layer With the above configuration, it is a total of 23-Layers Fully Convolutional Networks structure. It should be noted that the size of the final output, Segmentation Map, is smaller than the size of the input image. This is because padding was not used in the convolution operation.
Residual block:*
Residual blocks have also been proposed to solve the degradation problem.
 where FM(x) is a feature map expected from applying two convolutional layers to input features expressed as F(x), and the original input x is added to this transformation. Adding the original feature map alleviates the degradation problem that appears in the model. Below are the processes used in this work.
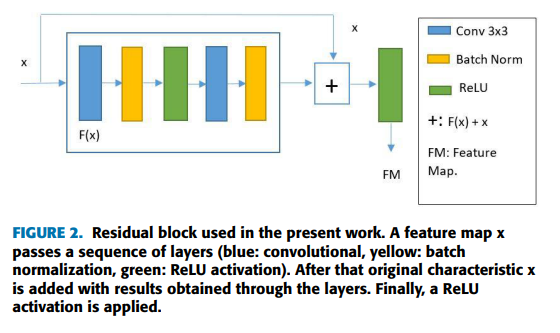
U-Net2 with Residual blocks:
The output of the U-Net network and the input part of the second network are connected. The number of channels and image size of each level remained the same as the decoding portion of the first half. However, both Contracting and Expanding added residual blocks at a new level. And since binary classification is performed in the last Expanded, 1x1 convolution is applied
Most of the pixels in that image are background and only a few represent vascular structures (class unbalance). For this reason, the loss function is used and the equation is shown below.

This function maximizes the overall probability of the data, by giving a high loss value when classification is wrong or unclear and a low loss value when prediction matches the expected by the model. The logarithm performs the penalizing part, the lower the probability, the greater the logarithm. Since these probabilities have values between zero and one, and the logarithms in that range are negative, the negative sign is used to convert them into positive values. To handle the problem of class unbalance, the weight attribute is provided, and each class is assigned both the prediction and the reference.

where the weight w varies randomly between 1 and α values, and s is a step. This dynamic weight change prevents the network from falling to a local minimum. To obtain the log probability, the LogSoftmax function is applied to the last layer of the neural network..
4. Experiment & Result
Dataset
DRIVE
Each image resolution is 584*565 pixels with eight bits per color channel (3 channels).
20 images for training set
20 images for testing set
CHASEDB
Each image resolution is 999*960 pixels with eight bits per color channel (3 channels).
Evaluation metric
The retinal image shows an unbalance in classes, so the suitable metric should be selected. Researchers adopts Recall, precision, F1-score, and accuracy.
Recall: tells us how many relevant samples are selected.

Precision: tells us how many predicted samples are relevant.
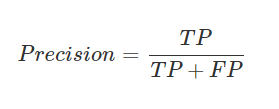
F1-Score: is the harmonic mean between recall and precision.

Accuracy: measures how many observations, both positive and negative, were correctly classified.

Results
1. Performance
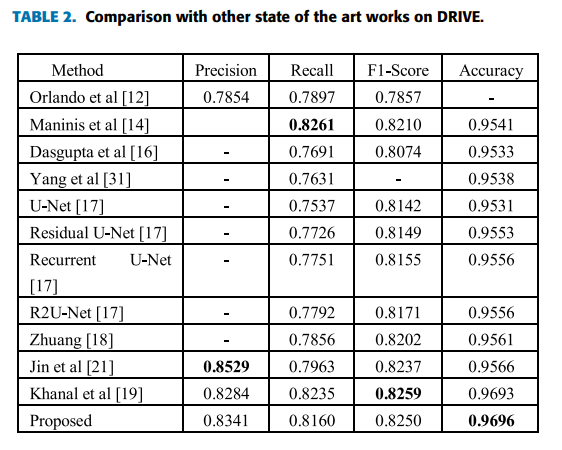
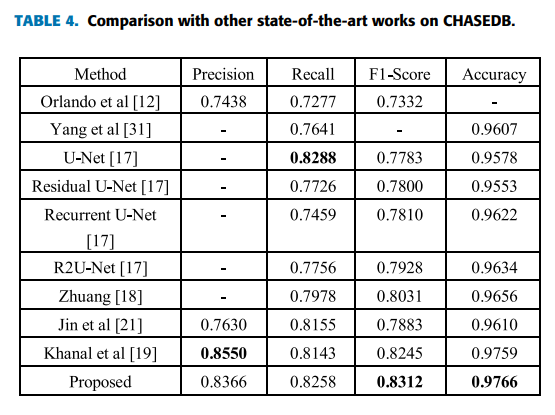
Based on the above metrics, performance is compared with previous studies
Both Precision and Recall have high values due to the high value of F1-Score
Suitable for vascular classification
Accuracy showed a high figure and 2nd highest result for F1-Score
In most cases, this study was consistent with ground truth, and FP and FN were also small
2. Training time

This architecture saves a lot of time compared to [Khanal et al.]
Approximately 1 hour faster for DRIVE dataset
Approximately 10 hours for the CHASEDB dataset
3. segmentation and The structural similarity index(SSIM)

 Segmentation Results for Drive and CHASEDB dataset
The structural similarity index (SSIM) is introduced to evaluate the segmentation process to compare the first step with U-Net1 only and the second part with the addition of residual blocks.

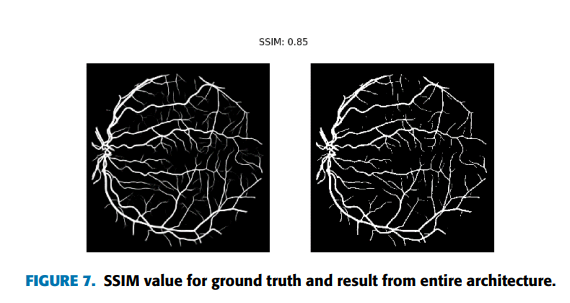
The structural similarity index analyzes the viewing distance and edge information between gtound truth and test images. This is measured by quantifying the degradation of image quality (used for image compression), which has a value of 0 to 1, and the higher the quality, the better. Figure 6 compares U-Net1 with ground truth, and Figure 7 compares the entire architecture (U-Net1 + U-Net2 with residential block) with ground truth. The latter has a higher figure.
4. Factors that reduce segmentation performance
Chunk
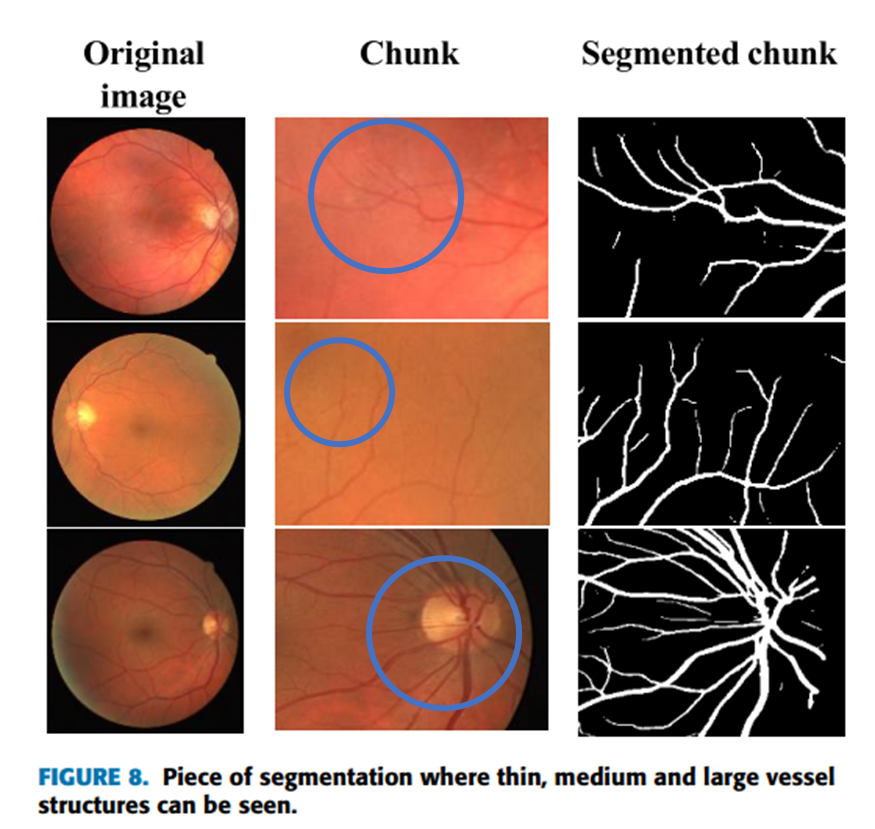
If you look at the blue circle, you can see that the blood vessels are relatively chunked. It is an important problem in image segmentation, and it can be seen that the above is well distinguished.
Avoid the lesion well?
 The DRIVE dataset has seven images containing lesion region, which can be mistaken for blood vessels and segmented. In the above Figure, it seems that it was well performed avoiding the lesion area (c).
➔ Quantified indicators are needed.
5. Conclusion
The nobelty of this study
The first is the addition of residual blocks to the U-Net1 network. This has greatly contributed to mitigating degradation of the image.
Second, the information obtained from the previous U-Net1 is linked to the residual blocks of the later U-Net(U-Net with residual blocks) to minimize the information loss.
This study achieved both performance and training time.
shows similar performance to previous studies
It can be significant that the training time has been greatly reduced.
Image pre-processing process
The gray scale conversion, normalization, CLAHE, and gamma adjustments are used to create a high-quality input image
Patch the original image to augment and secure the data
Take home message
High-accuracy image segmentation requires effort and time consuming. In this paper, the previously proposed architectures were well utilized, and through this, the results could be obtained with a short training time. In addition, high-quality in-put images could be obtained through image pre-processing. As a result, it seems that the trade-off between training time and performance could be minimized.
Author
Korean Name (English name)
Reviewer
Reference & Additional materials
[Original Paper] G. Alfonso Francia, C. Pedraza, M. Aceves and S. Tovar-Arriaga, "Chaining a U-Net With a Residual U-Net for Retinal Blood Vessels Segmentation," in IEEE Access, vol. 8, pp. 38493-38500, 2020
[Blog] https://medium.com/@msmapark2/u-net-%EB%85%BC%EB%AC%B8-%EB%A6%AC%EB%B7%B0-u-net-convolutional-networks-for-biomedical-image-segmentation-456d6901b28a
Last updated